Search This Blog

Saturday, November 3, 2018

Homelab Cluster: Hardware Finally Done

The day has finally come: I'm happy with the homelab's hardware. *fireworks*

Final list of hardware:
1. Headnode: ASUS Z10PE-D8, 2x Xeon E5-2690V4 ES (14c @ 3GHz), 8x8GB 2Rx8 PC4-19200 ECC RDIMMs, 500GB Samsung 960 Evo NVMe (CentOS 7.5), 2x 3TB HDD in RAID1 (data), 480GB SSD (Windows), GTX Titan, CX354A FDR IB HCA.
2. Compute nodes: Supermicro 6027TR-HTR, which has 4x nodes: 2x E5-2690v2, 8x8GB dual rank PC3-14900R ECC RDIMMs, 120GB SSD (CentOS 7.5 compute node), CX354A FDR IB HCA.
3. Mellanox SX6005 FDR switch with Sonoff wifi power switch
4. 2x 8 port unmanaged 1Gbe switches, one for IPMI, one for intranet
5. Riello UPS: 3300VA, 2300W
6. APC NetShelter CX Soundproof Cabinet with custom, automatic heat extraction system

Here are some pictures:

The whole homelab + 3D printer. It's final position will be about 2 feet to the right. The plywood under it is to allow for easy rolling over the carpeted floor. My desk with the monitor is just to the right.


Front of cabinet. Looks clean and organized.

Back is a little bit of a mess, but it's the best I could come up with. All of the cables are too long, so I had to coil them.

Close up of heat extraction electronics. The controller board is mounted in its new 3D printed tray.

Mounted power strip for not-C13-plug things
It's currently cranking through TB's of astrophysics data. I'll be running CFD cases on it soon.

Possible future changes

Since I just got finished saying that the homelab cluster is finished, it's time to list some possible future upgrades, because that's how this hobby goes...

1. Clean up the wiring a little more. It's kind of ugly in the back due to all of the coiled up wires. I'm not really sure how to make it neater without custom cables, though, and that definitely isn't worth the time/money involved to me. 

2. Rack rails/strips. Racking the server and switches might help clean up the wiring inside slightly and make it look neater. The biggest problem with doing this is that I will lose the ability to pull the SM compute nodes out. They come out of the back, and I currently have to slide the server to the side/angle it so that I can pull a node out of the back door. If the server chassis is racked, I won't be able to do that, so I'd have to pull the whole chassis out in order to get to a node. Aside from make it look a little prettier, adding rack rails would be pretty pointless, so this probably won't happen.

3. AMD EPYC. The new AMD EPYC processors are awesome for CFD. Each has 8 channels of DDR4-2666 RAM = crazy high memory bandwidth = more tasks/CPU before hitting the memory bandwidth bottleneck. Looking at the OpenFOAM benchmarks, two dual 7301 servers with dual rank RAM (4 CPUS, 64 cores @~2.9GHz) should be faster than my entire cluster (10 CPUS, 108 cores @~3GHz), and it's almost all thanks to memory bandwidth. Unfortunately, the economics don't make any sense. Building just one dual socket 7301 server/workstation would cost more than I spent on this whole cluster, even if the RAM, CPUs, and motherboard were all purchased used. Because its new hardware, there aren't many used EPYCs or motherboards on the market yet. Also, DDR4 RAM is absurdly expensive, mostly due to price fixing/collusion between the only three RAM manufacturers in the world. Two dual socket EPYC servers would require 32x dual rank 2666 RAM, which for 8GB at the cheapest (new) prices I could find would run about ~$3500....ouch. Again, since that's the latest speed RAM, there isn't much pre-owned DDR4-2666 yet. I did an electricity price analysis to see if it would still make sense economically to upgrade. Assuming running for 1/2 of a year, the current server would use 6100 kWh. At $0.22/kWh (England...), that's about $1350/year in electricity. I think two AMD EPYC servers would use about 900W. That's about $870/year in electricity, for a savings of ~$480/year. Even including selling off what I currently have, it'd take more years than it's worth for me to break even. So if/when this upgrade occurs, it will be in the future when the prices come down. One really exciting prospect of the EPYC chips is that they allow overlclocking. The famous overclocker der8auer's EPYC build used a prototype Elmor Labs to EVC v2 to overclock dual 7601's to 4GHz (all cores) on a Supermicro H11DSI and an ASUS RS700a-e9. He had to use novec submersion or dry ice, but he was able to get a fairly good overclock with a water cooler. Overclocking doesn't make sense in a large cluster/data center environment where running costs (electricity, cooling, maintenance) dominate. Power (and thus heat) scales with frequency cubed, so it's cheaper for them to buy more servers and not overclock. But in a homelab/small cluster environment, where initial hardware costs are usually the dominating factor, overlcocking makes a lot of sense, so this might be something I look into in a few years.

4. Add internal LED lights that come on when either the front or back doors are opened. These would probably be in the form of stick-on strips along the top front and top rear of the cabinet running off of the heat extraction system PSU. The only reason I haven't done this is that I doubt I'll be opening the cabinet much anymore now that everything is situated, heat extraction is automatic, and powering on equipment can all be done remotely.

Thursday, November 1, 2018

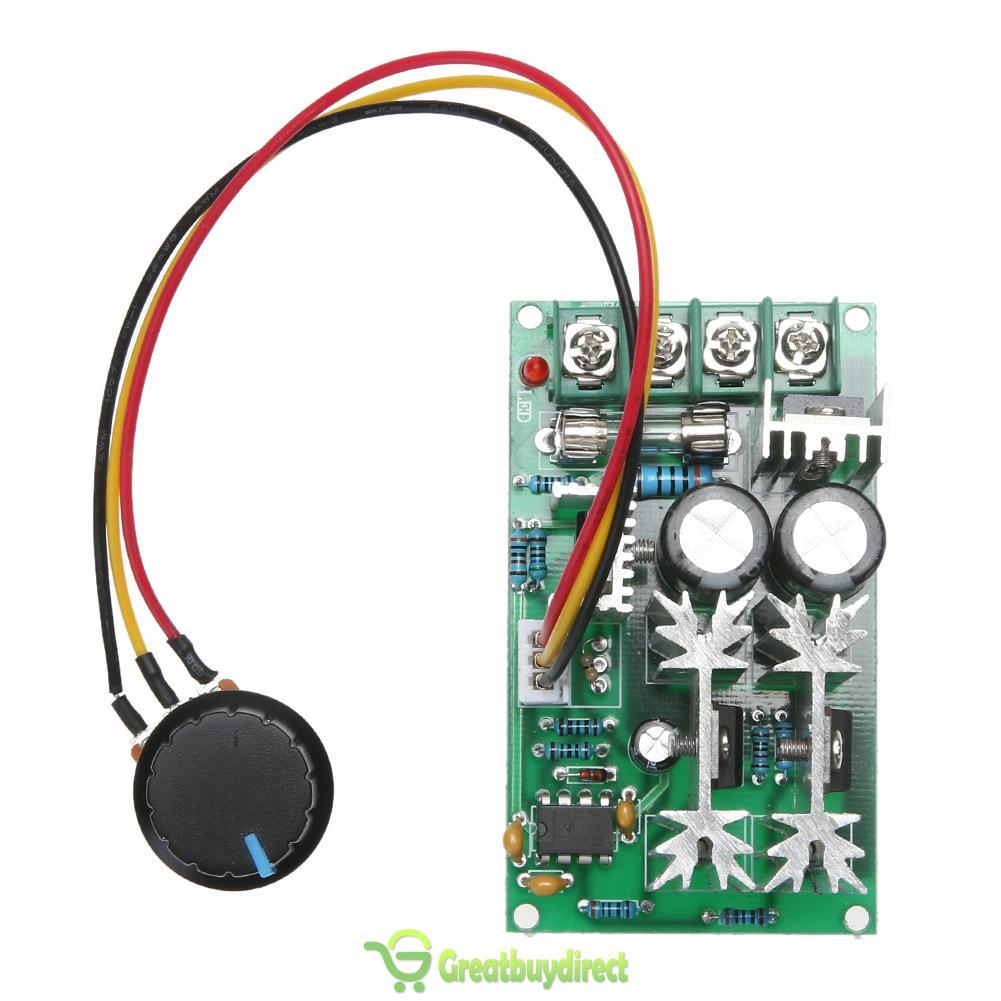
Review of Cheap Fan Temperature PWM Controllers

I purchased a couple more types of cheap (~$5) temperature fan controllers from eBay. There are about 5 or so different types. Since I reviewed one previously, and I now own three of the most common ones, I thought I'd do a review of all of them in one place.

First, a brief review of standard fan control methods. There is a lot of confusing terminology out there regarding small dc fan control. 2 pin fans just have power and ground. These can be controlled either by varying voltage linearly, or by PWM'ing the power line. The former only works down to ~half the rated voltage for most fans or they don't have enough power to start. The latter requires a PWM fan controller. 3 pin fans have an extra wire that outputs the tachometer readings. This is useful for measuring fan speed if the power source is constant, i.e. not PWM'd. If the power is PWM'd, then the sensor is, too, which usually messes up its readings, unless the PWM frequency is much greater than the RPM. 4 pin fans have power, gnd, tach, and control wires. In addition to the two methods mentioned for two pin fans, these have a third option for control. In stead of PWM'ing the power wire, a low voltage/low current PWM signal can be sent to the control wire. The fan's internal electronics then handle the actual power PWM'ing. This has the added benefit of not screwing up the tach sensor readings because the voltage on the power wire is still consistent. Unfortunately, finding a cheap controller for these fans is difficult. Noctura makes a ~$20 manual pot one, but that's the only one I could find. I'm reviewing the three most common cheap chinese eBay ones here.


Fan Controller 1


This is the controller I reviewed in March. It can handle two fans of 2, 3 or 4 pins in 2-pin control mode. 12-24V input, max 4A output. It will automatically adjust the two fan outputs' duty cycle based on the reading from a temperature probe.

The control chip is a TC648 dedicated fan temperature controller. Unfortunately, the PWM switching frequency is about 30 Hz, and is audible/visible and annoying. If the switch is up, the potentiometer allows for tuning the turn-on temperature, which is nominally 30C, and always about 20C lower than the max temperature, nominally 50C. The pot is very sensitive. If the switch is down, supposedly the temperature set points are fixed at 30C and 50C, but I don't think they're accurate. At 12V, the acceleration is smooth, but very slow. At 24V, the acceleration in the control band is underdamped, so the fan speed oscillates wildly. Note that the 2A or 3A versions have one missing FET (like the one pictured), but the 4A one has all of them. Because this one pulses the power pin, there is a voltage drop across the board that results in the fan not operating at the same maximum RPM as if it was plugged directly into the power supply.

Conclusion: Not recommended.

Fan Controller 2
This controller only works with 12V 4 pin fans operating in 4-pin control mode. Each of the three fans has a max operating current of 3A.  It should be possible to splice a wire from the 12V input line to the fan's 12V cable in order to have a higher than 3A current limit. It will automatically adjust FAN1's PWM (control pin, not the power pin) duty cycle based on the temperature read by the short temperature probe. FAN2 and FAN3 are only controlled manually by the two potentiometers. FAN2 and FAN3's minimum duty cycle is 10%.  There is a stalled fan warning beeper. There are 5 DIP switches. Switch 1 controls the minimum duty cycle of FAN1, either 20% or 40%. Switches 2 and 3 allow for the selection of one of four minimum and maximum temperature pairs: 35C-45C, 40C-55C, 50C-70C, 60C-90C. Switches 4 and 5 control the behavior of the stall alarm for FAN1 and FAN2. All fans will always be on: there is not automatic shutoff. The chip is not marked, but it must be some sort of microcontroller. Come to think of it, a simple microcontroller will probably be cheaper than a chip specifically designed for fan temperature control because more microcontrollers are produced than fan control chips.

The temperature control works fairly well: acceleration is smooth in the control band. The pot controlled fans are adjustable from about 10-100% duty cycle. It reaches the same max RPM as if the fan was directly connected to a 12V source. Board current consumption is very low, a few 10's of mA.

Conclusion: If you have 12V 4-pin fan(s), and one of those temperature ranges works for you, and especially if you need to manually set two other fans as well, then this is a good pwm fan temperature controller for you.

Fan Controller 3
This controller works with 12-60V 4 pin fans operating in 4-pin control mode. Each of the two fans has a max operating current of 3A.  It should be possible to splice a wire from the power input line to the fan's power cable in order to have a higher than 3A current limit. It will automatically adjust FAN1's PWM (control pin, not the power pin) duty cycle based on the temperature read by the long (~1m) temperature probe 1, and the same for FAN2 and temperature probe 2. In other words, it has two separate control zones, which is nice. The low and high temperature ranges are settable from 0-60C and 10-70C respectively, in 1C increments.The interface is the best out of all of them: buttons for selecting modes and changing settings, and a 3 digit 8 segment display, along with 4 indicator LEDs for displaying the current settings, temperatures, and fan RPMs. The temperature probes are long and potted in metal tubes. It has a stall alarm for both fan outputs. Fan minimum duty cycle is adjustable between 10-100% in increments of 1%, which can be used to manually control the fans if the minimum start temperature is set higher than ambient. This one is a bit larger than the other boards, and current consumption is about 40mA. Fans are always on: not auto-shutoff feature. The two chips near the top are shift registers (74hc595d) for the 8 segment displays and the LEDs. The chip near the capacitor is a buck converter (xl7005a) for powering the board, and the chip on bottom left is a microcontroller (N76e003At20).

It works great. Acceleration is silky smooth from the low temperature set point to the high temperature set point. It reaches the same max RPM as if the fan was directly connected to the power source. Acceleration is a little slow, likely because of the potted temperature probes taking a long time to heat up. It's faster than Fan Controller 1, though. I haven't tried this with voltages other than 12V input, but my guess is the behavior would be the same due to the buck converter.

Conclusion: This board is awesome. If you need to do temperature control, especially dual zone, of 4-pin fans of 12-60V, then this is the board for you. I will be using this in my homelab's cabinet to control the heat extraction fans. The only feature I wish it had was automatic stop/start of the fans so they wouldn't run when below the min temperature threshold.

Fan Controller 4
This controller is not a temperature controller, but a manual PWM controller. The PWM duty cycle (power is PWM'd, so this would be 2-pin fan mode) is controlled by the potentiometer. It has one output, and is supposedly rated for up to 60V and 20A, though considering how hot it gets with just a few amps, I'm not sure I'd want to push 20 through it. On 12V, as you turn the pot, the output is fairly smooth, but with 24V, only the first ~3% of the pot can be used to change RPM, the rest is full speed. The PWM frequency is high enough not to hear or notice, unlike Fan Controller 1, so that's good. It works, so if you just need manual fan control of 2 or 3 pin fans, especially high power ones, then this is a good choice for you.

Hopefully this review will help someone in the future choose a PWM fan temperature controller.


As I mentioned above, I will be using Fan Controller 3 moving forward. I had to create a new wiring harness.


I'm using FAN1's output to control all three fans. Because their total current is greater than 3A (limit of a fan connector), I had to run bypass pwr and gnd wires directly to the power supply. I pulled the pwr pin from the 4-pin fan connector that plugs into the controller to prevent current from being run through the connector. I also soldered small power wires for the controller to the fork terminals on the bypass wires. The three PWM control pins are wired together in the harness to the single blue wire connected to the controller, but only one of the yellow tachometer wires is so the tach signals don't mix. I 3D printed some terminal covers for the power supply because it didn't come with any. I'm going to 3D print a green tray to hold the controller PCB and to shield its back from shorting. I'll set the set points to 30C-40C, and the temperature probe will be taped to the top back of the cabinet. If that part of the cabinet gets to about 30C, then the heat extraction fans aren't moving enough air to prevent hot air from recirculating to the front of the servers, so they need to ramp up.

When I was testing Fan Controller 3, I noticed that the 10% duty cycle command only corresponded to 50% of the max fan RPM and the 100% duty cycle corresponded to max fan RPM. At first, I thought something might be wrong with the controller, but measuring the average DC voltage of the PWM control pin showed that it, at 10% duty cycle setting, was reaching about 12% of the voltage at max duty cycle duty cycle setting, so that meant the controller was probably fine. Unfortunately, Mechatronics, the manufacturer of the fans I purchased, does not publish PWM vs. RPM data. I found digging through their website that 50% is the minimum fan RPM, which is what I observed earlier. It's unfortunate that those fans don't allow for lower RPM operation. I measured operating current and found that at the lowest setting, the fan draws 19% of the power it does at max RPM, which is a savings of ~35W for all three fans. It'd be nice if the fan controller could turn the fans off, but that'd only save an additional ~8W. Compared to leaving them running at full speed all of the time, I'm probably saving somewhere around $30/year (assuming the fans are at min throttle half of the year) by implementing fan temperature control.


On a separate note, I tried installing a second fan on the CPU cooler on CPU1 in the headnode. The Cooler Master Hyper 212 Evo's come with an extra pair of brackets for mounting a second 120mm fan on the other side of the heatsink. The 120mm fans and y splitters I bought were 3 pin, though, instead of 4-pin, which means that both fans ran at 100%. It'd have been better to buy another 4-pin fan and a 4-pin splitter cable so that they could be throttled with load. I realized that full speed was a lot faster than I had seen the fan spin before. I did a stress test with both fans installed, and the temps hovered below 50C. This made me think that maybe there was a BIOS setting for the fans, and there is. I switched the CPU fan mode to "high speed", took the second fan off of CPU1's heatsink, and ran the stress test again. The temperature of both CPUs hovered around 59-60C, which is great: about 5-10C lower than before and no large temperature difference between CPU1 and CPU2. So I don't need the second fans. Yay.

So, to do:
1. 3D print control board holder, install the new fan controller.
2. Replace ntpd with chronyd.

Sunday, October 28, 2018

Headnode Windows-Nvidia GPU Nonsense

I recently got into light computer gaming for the second time in my life. My parents never let me have video games as a kid. I played the MMORPG Mu for about a year in middle school, but lost interest. I started playing Diablo 3 a few months ago...it's pretty fun. I use my Windows 10 Pro installation (separate SSD) in the  the headnode for the game. My headnode has a GTX Titan (original, superclocked), so it's perfectly capable of running Diablo 3 at the max framerate my screen can handle 60FPS). And it was working fine, until one day I started getting the blue screen of death and/or crashes every few minutes.

At first, I thought it might be the new windows update installed nvidia driver not playing nice with Diablo 3. I installed the latest nvidia driver from the website, but that didn't help. I also tried the oldest available on the website (388.31) after uninstalling the other, but that also didn't work. To make sure it wasn't just Diablo, I ran some stress tests, specifically userbenchmark and furmark. Both caused crashes. This meant it was either a driver problem or a hardware problem. Since I could control a software problem, I decided to try that first.

It turns out that not completely, completely, uninstalling and removing an old nvidia driver can cause crashes. So I downloaded the popular DDU (display driver uninstaller). This program suggests booting into safe mode, so I did that, and ran it with the default options. This deleted the driver(s) I had attempted to install. On normal boot, the gpu was using the basic windows display adapter according to the device manager. However, a few minutes after booting into normal Windows, Windows Update automatically installed an nvidia driver for it. Ah...maybe that's what's going on. It turns out removing the windows update driver and preventing its installation is a pain. Here's the process for it (Windows 10 Pro):
  1. Boot into safe mode
  2. Run DDU to delete nvidia drivers
  3. You can skip the above two steps if you have not tried to install any nvidia drivers yourself. Boot into normal mode. This auto installed the windows update nvidia driver after a few minutes.
  4. Follow this link for "rolling back" a driver. In short, go to the device in the device manager, go to the drivers tab, and click rollback. Note that nothing else in that link worked for me (uninstalling an update, blocking installation of an update via that troubleshooter tool). 
  5. Follow this link for how to block windows automatic driver installation for a particular device. To do this, you need to copy the hardware IDs from the GPU's device manager details tab, then adding a "device installation restrictions" group policy (gpedit) for those hardware IDs. Windows may download or try to update the nvidia drivers now, but it can't because of this block. 
  6. While you were doing 4 and 5, windows probably reinstalled its nvidia driver. You need to boot into safe mode again, and run DDU. DDU has an option to prevent windows from updating drivers, as well as an option to delete the nvidia C:/ folder. Select those options.
  7. Reboot into normal mode
  8. Check the GPU in device manager: it should be using the basic windows display adapter driver. Wait about 10 minutes. If Windows does not install the nvidia driver automatically, then you're all set. If it does, then go back to step 4 and try again, maybe with some more googling. Mine did not auto-update after this. 
  9. Now install the driver and physx only. If you use 3D, then you need the 3D drivers. If you have a separate high performance audio card, then the audio driver might be useful to you. Otherwise, don't install those. Don't install geforce experience unless you want to stream/record. I used the oldest driver listed on the website (388.31) because my GPU is older.
At this point, try your GPU again with the stress test programs. If it works, then you're all set. However, mine still failed. I tried some of the other drivers, but none helped. This led me to think it was a hardware issue, possibly overheating. I did the following to underclock it: 
  1. Install MSI Afterburner
  2. Turn down clock speed, reduce max power to 90% or lower
  3. Change fan profile to hit full throttle earlier
  4. Save the profile, apply it (check mark), and click the button that launches msi at startup. This will apply the saved profile to the GPU everytime you boot windows. 
Unfortunately, this didn't help either. At this point I tried my other GTX Titan, but it still caused crashes. Note that, when you switch GPUs, you need to let windows install the basic adapter or the nvidia installer won't recognize your GPU. After that, you need to add the new GPU's hardware id's (every GPU has different hardware IDs) to the group policy from earlier to prevent windows from installing its nvidia driver. Anyways, this led me to believe it wasn't the GPU or driver.

Sometime between when it worked and when it stopped working, I had switched the CPUs to the new v4 ES's and moved the GPU from slot 1 to slot 3 (both on CPU 1). I wonder if either of those could have something to do with it. I tried moving the GPU from slot 3 up to slot 1. I repeated the instructions above for a clean driver (oldest) install, and did the underclock. This passed the stress test! Max GPU temps never got above 62C, so I could probably undo some of the underclock. My guess is that the ES (which is not a QS) in the CPU1 socket has some unstable PCI lanes that are associated with PCI slot 3 which are causing crashes under high loads. Interesting, I had tried the FDR Infiniband HCA in slot 3, and it worked great, but it's only x8 instead of x16, so one/some of the other lanes are probably at fault. I'll have to keep that in mind if I ever want to use more than one GPU in this build. It's possible that the other ES (CPU2) has the same problem. So in summary, I probably had a combination of driver conflicts and unstable pci lanes which were causing crashes under high loads. Hopefully this guide will help future nvidia GPU owners diagnose crashes, BSODs, and other problems.


To do: 
1. Switch from ntpd to chronyd
2. Add a second fan to each CPU cooler
3. Figure out how to deal with switching the heat extraction fans on and off so I don't have to open the cabinet door every time.

$31 Filament Dryer? Heck yes

This is a post I made on the /r/3Dprinting subreddit a few months ago.

I started seeing the signs of moist PLA filament a few weeks after opening a spool, so I bought this food dehydrator on eBay: item: 182608105385. It comes with shelves that just rotate to lock/unlock, so they're super easy to remove, making it perfect for a filament dryer. It will hold two normal width 1kg filament spools, or one wide spool + one normal spool (total internal height ~15cm).


The best part? Take a close look at the PrintDry Dryer and compare it to the picture I posted and in the eBay description. They use the same dryer base! The only difference are the filament tray/cylinder things and the "printdry" decal, and this being 1/3-1/4 the cost.

I'm sure I'm not the first person to realize this, but I thought I'd share. I've seen food dehydrator conversions, but they usually require some modifications like cutting out shelves or printing custom cylinders to hold the filament spools. This just worked out of the box.

Update January 2020: I found an almost identical one in the US on eBay, Rosewill brand, for a tad under $40 shipped. The base is identical except it as F and C units, and it runs on 110V instead of 220V like the UK one. The lid is the same. However, the shelves are molded into the rings on this one, which means I can't take them out easily. I may laser them out if I can get the laser head high enough. I could also try to cut them out. Anyways, I just replaced the old base with the new one for now. I took the old one apart. It's very basic. It has an AC motor that drives an impeller fan, which blows air up through a central core that contains a wire heating element similar to a blow dryers. The wire heating element's power is routed through a weird multi-plate resistor looking thing that's attached to the temperature knob...not really sure how that works. 


Monday, October 22, 2018

More thermal management

The headnode's CPU 1 sometimes shows temperatures about 6C higher than CPU 2, despite the same reported power draw. I tried tightening the screws on CPU slightly, but I don't want to wrench them down due to the lack of a back plate. It seemed to help slightly, maybe 1-2 C. The temperatures aren't breaching 70 C, so I'm not too concerned. I moved the GPU down a slot to give more room for the CPU fans to intake air.

As a follow on to this post, I purchased 3x new heat extraction fans. I couldn't get the 24V versions cheaply, so I bought 12V ones and a new 12V power supply for them. The ones I had in there before were louder than everything with the cabinet open, which defied the purpose of a soundproof cabinet. The new ones have same total max flow rate, but lower pressure and total noise. I soldered on fan connectors, made a custom 3 way splitter, connected them up, reinstalled the fan bracket, and tried it out. MUCH quieter with the cabinet closed up now. Definitely quieter than the server and switch with open doors, so that's good. The flow rate isn't as high, so I'm guessing there is more pressure drop than what I was measuring with the water manometer. I have them connected directly to the power supply instead of through the PWM fan controller because I think they will need to operate at full throttle all of the time. Total power draw is about 40W, which is a small price to pay for a quieter server. I did some stress testing to see how hot it would get in there. The server's system temp got to about 39 C with the doors closed, which is just 2C higher than with them open. No thermal shutdowns, so I think that's a success. I got that annoying segfault error again, twice. It said the source was the headnode this time, instead of node005. I'm not sure whether it's actually a component going bad, or some weird thing with the code. When it occurs is inconsistent, too. 

I purchased and installed 2x new 140mm case fans in the headnode into some blank spots to help with heat extraction. I also purchased another one to replace the fan in the PSU because it was clicking. However, when I took the fan out and ran it separately, it no longer clicked. I think the fan cable had wiggled loose and was touching the fan blade when it was installed in the PSU because, after I secured the cable, it no longer clicked. The server is pretty quiet now, even when running full blast.

I also mounted the power strip on the side of the cabinet. I had tried various tapes before, but they all eventually failed. This time, I drilled and screwed in brass M3 threaded inserts, 3D printed some brackets I designed to hold the power strip, and screwed them on. After that, I cleaned up the rest of the wiring in and around the cabinet.

No more falling power strip


To do:
1. Replace ntp with chrony on all nodes (ntp works between nodes, but headnode won't sync)
2. Figure out how to deal with switching the heat extraction fans on and off so I don't have to open the cabinet door every time.

Sunday, October 21, 2018

More OpenFOAM benchmarks

Now that I have the FDR Infiniband system installed, it's time to run some more benchmarks. The first test I did was 40 cores, headnode + node002. This completed in ~47 s, which is about 1-2s slower than with QDR. Not sure why it would be slower, but the one I recorded for QDR might just have been on the fast side of the spread from repeating tests. I then ran 100 cores (all nodes) and got ~14.2s , which is a speed up of ~25% compared to QDR. What's interesting is that this represents a scaling efficiency > 1 (~1.3)...in other words, the 20 core iter/s for the headnode + 4* the 20 core iter/s of a compute node is less than the 100 core iter/s for all 5 nodes with FDR. I have no idea how that could be possible. With QDR, I got perfect scaling (100 core iter/s = headnode + 4*compute node iter/s), which is what made me think upgrading to FDR wouldn't actually do much, but it really did. Perhaps summing iter/s isn't the best way to calculate scaling efficiency? I'll need to look into this more. Anyways, I'm really happy with the performance boost from FDR. I tried switching the HCA to a CPU 1 slot to see if it would make a difference, but it didn't, so I moved it back to a CPU 2 slot (bottom, out of the way).

In a post a few weeks ago, I mentioned I would be upgrading the headnode to 2x Intel Xeon E5-2690 v4 ES QHV5 (confirmed ES, not QS). Specs: 14c/28t, base frequency 2.4GHz, all core turbo 3.0 GHz, single core turbo 3.2 GHz. They're in perfect condition, which is rare for ES processors. The all core turbo is 3.0GHz, which is the same as the 10c/10t E5-4627 v3 QS I currently have. I replaced the Supermicro coolers and the E5-4627 v3's with the new procs and the Cooler Master Hyper 212 Evos.


I oriented the coolers so the airflow would be up. I'm planning on getting 2x more 140mmx25mm fans for the top heat extraction. I think I can wiggle the RAM out from under the coolers if I need to, which is convenient. This motherboard has the same issue that the SM X10DAi (which I finally sold thank goodness) had: the holes for the cooler are not drilled all the way through this motherboard, so you can't install the back plate. Instead, you have to screw the shorter standoffs into the threaded holes, then the CPU cooler bracket into those. Make sure not to over-tighten the CPU bracket screws because they are pulling up on the CPU plate, which is only attached to the surface of the motherboard PCB. If you tighten them too much, it could flex the plate enough to break it off the PCB.

Unfortunately, I completely forgot about clearing the CMOS, so I spent about an hour head scratching about why the computer was acting funny and turbo boost wasn't working. Once I pulled the CMOS battery (behind GPU, ugh) and cleared the CMOS, everything worked normally. Lesson learned: If no turbo boost with an intel cpu, trying clearing the CMOS. After that, I went into the BIOS and fixed all the settings: network adapter pxe disabled (faster boot), all performance settings enabled, RAID reconfigured, boot options, etc.

After confirming turbo was working as it should, the next step was to run the OpenFOAM benchmark on 1, 2, 4, 8, 12, 16, 20, 24, and 28 cores. On 20 cores, the new CPUs are ~10% faster than the old ones. Since the core-GHz was the same, that means the improvement was mostly due to memory speed/bandwidth. The RAM can now operate at 2400MHz instead of 2133MHz, which is about 12.5% faster. On 28 cores, the new CPUs were ~15% faster, only ~6% (4.5s) faster than 20 cores despite the additional 40% core*GHz. This is due to the memory bottleneck I mentioned in a previous post, and was expected. CPU1 showed about 5-6 C higher temps than CPU2 under full load despite similar power draws...I'll try tightening CPU1's heatsink screws a tad.

Finally, a full 108 core run: 12.7 s, or about 7.8 iterations/s. That's about 34% improvement over the 100 core, QDR cluster. Wow!

UPDATE (3 days later): I decided to do a 20, 40, 60, and 80 benchmark on just the compute nodes to try to track this greater than perfect scaling (iter/s / sumofnodes(iter/s)) thing down. The 20 took about 98 s, which is the same as before. The 40 took about 47s, which is the same as before, and about half the time with double the cores, which makes sense. But the 60 and 80 took about 10 s, which didn't make any sense. The cases were completing, too, no segfaults of anything like that, which I have seen in the past cause early termination and unreal low runtimes. I then compared how I was running each of them, along with the log.simpleFoam output files and figured out the problem. For less than 40 cores, I used the standard blockmesh, decomposePar, snappyHexMesh, simpleFoam run process. For greater than 40 cores, I tried something a little more advanced. snappyHexMesh does not scale as well as the actual solver algorithms, so for large numbers of cores, it can be less efficient to run the mesher on the same number of cores as you plan on running the case on. So I meshed the case on the headnode, then reconstructParMesh, then decomposePar again with number of cores I wanted to run, then ran it. What I didn't notice in the latter (n>40) cases were a few warnings near the top about polymesh missing some patches and that force coefficients couldn't be calculated (or something like that), and a bunch of 0's for coefficients in the solution time steps. The solver was solving fine, but it wasn't doing a big chunk of the work, so for the 100 and 108 core cases, the speed up appeared to be greater than 1. I fixed this and got 18.89 s for n=108, which corresponds to 0.98 scaling. Not as incredible as what I was seeing earlier, but still very very good.

Updated comparison
Reading the benchmark thread again, there were a few tips for getting the last little bit of performance out of the system. Flotus1 suggests doing these things:
sync; echo 3 > /proc/sys/vm/drop_caches\
echo performance | tee /sys/devices/system/cpu/cpu*/cpufreq/scaling_governor
The first clears the cache, and the second sets the OS's cpu scaling governor to performance (defaults to powersave). I didn't notice any improvement from clearing the cache, but the performance command did shave off about 1s (~1%) from the headnode's benchmark. To make that permanent, I created a systemd service script called cpupower.service:
[Unit] 
Description=sets CPUfreq to performance  
[Service]
Type=oneshot
ExecStart=/usr/bin/cpupower frequency-set --governor performance 
[Install]
WantedBy=multi-user.target
Then systemctl daemon-reload, and systemctl enable cpupower.service. This will load the service at boot, setting the cpufreq scaling governor to performance. Flotus1 also suggested turning off memory interleaving across sockets, but I don't think my motherboard does that because there were only options for channel and rank interleaving in the bios.

In other news:
I really need to learn my lesson about buying used PSUs...the fan in the Rosewill Gold 1000W PSU I bought is rattle-ing. Sounds like a dying phase. Ugh. This was the replacement for the used Superflower Platinum 1000W PSU that died on me a couple months ago. I'm going to replace the fan and hope nothing else breaks in it. Note to self: buy new PSU's with warranties.

To do:
1. Replace ntp with chrony on all nodes (ntp works between nodes, but headnode won't sync)
2. Install 2x new 140mm fans, replace 140mm fan in PSU.
3. Install new thermal management fans
4. Tighten CPU 1's heatsink screws
5. Move the GPU down a slot so CPU fans have more airflow room.


Friday, October 19, 2018

Infiniband and MPI benchmarking

I've done and documented a few benchmarks before now. One figured out if there was a performance difference between two HCA firmware versions using the perftest package. I've also run some OpenFOAM benchmarks. However, now I want to do some MPI bandwidth and latency comparisons between different types of Infiniband networks, specifically: 1. single rail QDR, 2. dual rail QDR (use both ports), 3. single rail FDR, 4. dual rail FDR (FDR10). Here a "rail" refers to a communication pathway, so "dual rail" means that both ports of the dual port HCAs are connected. Physically, it means plugging an Infiniband cable into both ports running to the same switch. OpenMPI by default will use all all highspeed network connects for MPI, which means using dual rail should be a breeze. The goal is to see which type of network achieves the highest bandwidth. I realize that some of these have theoretical performances higher than the available PCI 3.0 x8 bandwidth (7.88 GB/s), so it'll be interesting to see how close to that I can get. Speaking of theory, let's do some math first.

For PCI 2.0 (ConnectX-2), the speed is 5 GT/s per lane. The following equation then gives the max theoretical bandwidth of a PCI 2.0 x8 interface with 8/10 encoding: 
PCI_LANES(8)*PCI_SPEED(5)*PCI_ENCODING(0.8) = 32 Gb/s (4 GB/s)
So that is about the maximum I should expect from a PCI 2.0 x8 slot using 8/10 encoding. For PCI 3.0, the speed is 8 GT/s and the encoding changes to 128/130, which yields ~63 Gbit/s (7.88 GB/s) for a x8 slot. QDR and FDR10 Infiniband use 8/10 encoding. However, FDR uses a more efficient 64/66 encoding, though it's less efficient than the 128/130. A PCI 3.0 slot with 64/66 encoding has a max theoretical bandwidth of ~62 Gbit/s (7.76 GB/s). However, there are some more inefficiencies, so I expect the actual upper bandwidth limit to be slightly lower. QDR Infiniband is 4x 10 Gbit/s links with 8/10 encoding, which yields a theoretical max bandwidth of 32 Gbit/s (4GB/s). Thus, a single QDR link will saturate a PCI 2.0 x8 port. FDR10 Infiniband is 4x 10.3125 Gbit/s links, with 8/10 encoding, which yields 40 Gbit/s (5 GB/s). FDR Infiniband is 4x 14.0625 Gbit/s links, with 64/66 encoding, which yields 54.55 Gbit/s (~6.8 GB/s). Again, I expect some inefficiencies, so I doubt I'll hit those values. Since a single QDR link maxes out the PCI 2.0 x8 interface of the CX-2 HCA, I expect the dual rail QDR CX-2 case to not provide any additional bandwidth. The FDR10 and FDR cases will use a PCI 3.0 x8 interface. The single FDR link should not saturate the PCI 3.0 x8 slot, but dual rail QDR, FDR10, and FDR should, so their theoretical max bandwidths is the ~7.8 GB/s of the slot.

The first thing to do is install a benchmark suite. The OSU MicroBenchmarks is a popular MPI benchmark suite. Download the tarball, extract to a folder, go into the osu-benchmarks folder, and run the following:

module load mpi/openmpi-3.1.0
./configure CC=mpicc CXX=mpicxx --prefix=$(pwd)
make
make install

The first line is only if you've set up openmpi as a module, like I did previously. If not, then you need to point CC and CXX to the location of mpicc and mpicxx respectively. That will install the benchmark scripts in the current directory under libexec/osu-micro-benchmarks/mpi/. If you don't specify a prefix, it stuck the osu-micro-benchmarks folder in /usr/local/libexec for me. This needs to be done on the nodes you'll be running benchmarks on. I'm only going to do two node benchmarks, so I'm only installed this on the headnode and one compute node. In order to keep slurm power save from shutting down the compute node, I modified the SuspendTime variable in slurm.conf on the headnode and ran scontrol reconfig. I then turned on the QDR Infiniband network and made sure that the link was up.

I navigated to the folder containing the scripts, in particular the pt2pt scripts. I used the following commands to run a bandwidth and latency test:
srun -n 2 --ntasks-per-node=1 ./osu_bw > ~/results_bw_QDR_single.txt
srun -n 2 --ntasks-per-node=1 ./osu_latency > ~/results_latency_QDR_single.txt
Those run a bandwidth and latency test at many different message sizes between the headnode and one of the compute nodes, recording the results to text files in my home directory. You can use mpirun instead of srun, but you have to specify a hostfile and make sure that the compute node's environment (PATH, LD_LIBRARY_PATH) include mpirun. For the dual rail cases, you'll get an mpi warning about more than one active ports with the same GID prefix. If the ports are connected to different physical IB networks, then the MPI will fail because you have to have different subnet ID's for different subnets. Typically, when more than one port on a host is used, it's used as a redundant backup on a separate switch (subnet) in case a port goes down. However, I'm using them on the same subnet in order to increase available bandwidth, so I can safely ignore this warning, which also tells how to suppress it.

I ran the above for single and dual rail QDR (CX-2 cards) first. Then I put the new FDR CX-3 cards in and ran them again with the old Sun QDR switch. For the supermicro compute nodes, I had to enable 4G decoding in order to get the nodes to boot, though the headnode was fine without it. My guess is that the BAR space is larger for the firmware version on the CX-3 cards than the CX-2 cards, which is something I've run into before. Then I pulled the old switch out, installed the new FDR switch (SX6005), installed opensm, activated the opensm subnet manager (systemctl start opensm) because the SX6005 is unmanaged, and ran the single and dual rail FDR benchmarks again. Finally, I replaced the FDR cables with the QDR cables, which causes the link to become FDR10 (after a few minutes of "training", whatever that is). I then ran the benchmarks again. The end result was 16 text files of message size vs. bandwidth or latency. I wrote a little gnuplot script to make some plots of the results.


Examining the plateau region, it's clear that dual rail QDR (CX-2 HCAs) did not help, as expected. The max single rail CX-2 QDR bandwidth was about 3.4 GB/s, which is about 15% lower than the max theoretical of the slot and QDR (4 GB/s); these are those extra inefficiencies I mentioned. Single rail CX-3 QDR bandwidth was around 3.9 GB/s, which is only about 2.5% lower than the max theoretical QDR bandwidth. The majority of this efficiency improvement is likely due to the PCI 3.0 interface efficiency improvements. The dual rail CX-3 QDR bandwidth matched the single rail up to about 8k message sizes, then jumped up to about 5.8 GB/s. Since 3.9*2 = 7.8, which is about the max theoretical bandwidth of a PCI 3.0 x8 slot, the PCI interface or code must have some inefficiencies (~22-26%) that are limiting performance to ~5.8-6.2 GB/s. In fact, the FDR10 and FDR dual rail's had similar max measured bandwidths. The single rail FDR10 bandwidth was about 4.65 GB/s, which is about 7% less than max theoretical. The single rail FDR bandwidth was about 5.6 GB/s, which is about 18% less than max theoretical. Again, this is probably hitting some PCI interface or code inefficiencies. Doing echo connected > /sys/class/net/ib0/mode for ib0 and ib1 didn't seem to make a difference. That might only apply to ipoib, though.


Latency shows negligible differences for single vs. dual rail for medium-large message sizes. I only lose about 3-4% of max bandwidth (~13% near 32k) with the single rail FDR vs. the dual rail options. I don't currently own enough FDR cables to do dual rail FDR, but since the performance improvement is so small, I don't plan on purchasing 5x more of these cables.

Since I'll be using the SX6005 switch from no on, I enabled opensm so it will start every time the headnode boots.

This guy did something similar back in 2013. He got slightly higher bandwidths, and the FDR latency was higher than QDR for some reason. He does mention at the end that openmpi tended to have more variable results than mpich.

I decided to try to track down why I was seeing inefficiencies of ~22-26% in some cases. The first thing to check is process affinity. I discussed this some in a previous post, but basically the way processes are distributed to resources can be controlled. Since these tests only have two tasks, one running on each node, and there are 10 cores per socket and 2 sockets per node, then there are a total of 20 cores that the single task could be running on. Often, this task is bounced around between those cores, which is good for a normal computer running many different tasks, but it's bad for a compute node that only runs one main job due to the inefficiencies involved in moving that task around. Thus, it's better to bind that task to a core. There is some minor performance dependence based on which core in a socket the task is bound to, but there can be major performance differences depending on which socket the core (that the task is bound to) is in. If the IB HCA is in a PCI slot connected to CPU2 (logical socket 1), but the task is assigned to a core in CPU1, then the task has to communicate through the QPI link between the CPUs, which hurts bandwidth and latency. For the E5-4627 v3, the QPI has two 8 GT/s links, for a total bandwidth of about 2 GB/s...that could definitely be a bottleneck. I looked in my motherboard manuals for pci-CPU connections. The supermicro compute nodes' only slot is connected to CPU1 (logical socket 0), and the the ASUS headnode's HCA is in a slot connected to CPU2. But how do I know if core binding is on, and if so, what are the bindings? It turns out that it's hard to know with srun...there also isn't as much control over bindings and mapping in slurm. mpirun can output core bindings using the "--report-bindings" flag, but as I said earlier, I can't directly run mpirun without messing with the .bashrc/environment on the compute node. Instead of using the srun commands above, I wrote an sbatch script that calls mpirun. First, the SBATCH parameters job, output, ntasks=2, ntasks-per-node=1, nodelist=headnode,node002 are specified. These settings let slurm know that I'll need two nodes, and to put one of the two tasks on each node. Then the script runs "module load mpi/openmpi", which loads the mpi module. The mpirun command is then as follows:  mpirun -host headnode,node002 -np 2  -bind-to core -map-by ppr:1:node /path/to/osu_bw . It turns out that you don't need the -bind-to core or -map-by ppr:1:node flags; the results are the same without them. As long as task affinity is activated in the slurm.conf, then the default slurm behavior is to bind to core (and the ntasks-per-node sbatch command covers the map by node flag). Adding the --report-bindings flag revealed that mpirun placed a task on core 0 of socket 0 of the headnode and core 0 of socket 0 of the compute node. Interesting...perhaps some of the performance inefficiency is due to the fact that my headnode's HCA is in a CPU2 (socket 1) PCI slot.

At this point, I have replicated the srun command with sbatch...so why did I bother? Enter rankfiles. A mpirun rankfile allows you to specify exact task mapping on node, socket, and core levels, something you can't do in slurm. So I did that:
rank 0=headnode slot=1:0
rank 1=node002 slot=0:0
From the mpirun man page, "the process’ "rank" refers to its rank in MPI_COMM_WORLD", so rank 0 is the first task and rank 1 is the second task. The first line of the file says assign the first task to the headnode in slot (socket) 1 and core 0. The original slot 0 is fine for the compute node since that is where the HCA's PCI lanes are connected. Hint: use cat /proc/cpuinfo to get the socket ("physical ID") and core ("processor") logical numbers. I ran this for the single rail FDR case, and it made a big difference: ~6.3 GB/s. The inefficiency went from ~18% to ~7%! For dual rail FDR, bandwidth was about ~6.5 GB/s. Since the dual rail FDR should be able to saturate the PCI 3.0 x8 slot, then the max theoretical should be about 7.8, making the inefficiency about 17%...much better than 22-26%. I'd expect dual rail QDR and FDR10 bandwidth to be similar to the dual rail FDR. Latency improved, but not as much. The dual rail bandwidth is still only about 3% more than the single rail, so this doesn't change my conclusion that I don't need dual rail. However, if you have a company with a big QDR Infiniband installation with lots of extra switch ports, it would be cheaper to only replace the CX-2 HCAs with dual port CX-3 ones (assuming your hardware has PCI 3.0 slots, QDR already maxes out 2.0 x8) and double the number of QDR cables, than to replace all of the HCA's, cables and switches with FDR capable ones...AND you'd end up with slightly better performance. Another way to get around the PCI slot bandwidth limit, if you have enough slots, is to use multiple HCA's. For example, two single port FDR CX-3 HCA's in dual rail mode should be able to achieve ~6.3*2 = 12.6 GB/s, which is almost double what the single dual port FDR CX-3 HCA in dual rail mode could achieve. Cool stuff.

There's another way to get efficient process bindings with mpirun. I was able to achieve the exact same core bindings and performance as with the above rankfile by using the following command:
mpirun -host headnode,node002 -np 2 -bind-to core -map-by dist:span --report-bindings --mca rmaps_dist_device mlx4_0 /path/to/osu_bw
These flags tell mpi to bind processes to core and to map them by distance from the adapter mlx4_0, which is the name of the IB HCA (mine have the same name on all nodes). The nice thing here is that no rankfile was required.

I should note, though, that the original benchmarks involving crossing the QPI are probably a more realistic representation of max bandwidth and latency since all of the cores on a node will be used for real simulations. That's why I didn't bother to re-run all of the different cases.

To do:
1. Remove old QDR hardware.
2. Enable 4G decoding on other compute nodes and install FDR HCAs.
3. Plug everything back in/cable management
4. Run OpenFOAM benchmark with FDR.
5. Install new processors and coolers in headnode
6. Run OpenFOAM benchmark on headnode and cluster